Logging Architecture
Application and systems logs can help you understand what is happening inside your cluster. The logs are particularly useful for debugging problems and monitoring cluster activity. Most modern applications have some kind of logging mechanism; as such, most container engines are likewise designed to support some kind of logging. The easiest and most embraced logging method for containerized applications is to write to the standard output and standard error streams.
However, the native functionality provided by a container engine or runtime is usually not enough for a complete logging solution. For example, if a container crashes, a pod is evicted, or a node dies, you’ll usually still want to access your application’s logs. As such, logs should have a separate storage and lifecycle independent of nodes, pods, or containers. This concept is called cluster-level-logging. Cluster-level logging requires a separate backend to store, analyze, and query logs. Kubernetes provides no native storage solution for log data, but you can integrate many existing logging solutions into your Kubernetes cluster.
Cluster-level logging architectures are described in assumption that a logging backend is present inside or outside of your cluster. If you’re not interested in having cluster-level logging, you might still find the description of how logs are stored and handled on the node to be useful.
Basic logging in Kubernetes
In this section, you can see an example of basic logging in Kubernetes that outputs data to the standard output stream. This demonstration uses a pod specification with a container that writes some text to standard output once per second.
debug/counter-pod.yaml

|
|---|
|
To run this pod, use the following command:
kubectl apply -f https://k8s.io/examples/debug/counter-pod.yaml
pod/counter created
To fetch the logs, use the kubectl logs command, as follows:
kubectl logs counter
0: Mon Jan  1 00:00:00 UTC 2001
1: Mon Jan  1 00:00:01 UTC 2001
2: Mon Jan  1 00:00:02 UTC 2001
...
You can use kubectl logs to retrieve logs from a previous instantiation of a container with --previous flag, in case the container has crashed. If your pod has multiple containers, you should specify which container’s logs you want to access by appending a container name to the command. See the kubectl logs documentation for more details.
Logging at the node level
Everything a containerized application writes to stdout and stderr is handled and redirected somewhere by a container engine. For example, the Docker container engine redirects those two streams to a logging driver, which is configured in Kubernetes to write to a file in json format.
Note: The Docker json logging driver treats each line as a separate message. When using the Docker logging driver, there is no direct support for multi-line messages. You need to handle multi-line messages at the logging agent level or higher.
By default, if a container restarts, the kubelet keeps one terminated container with its logs. If a pod is evicted from the node, all corresponding containers are also evicted, along with their logs.
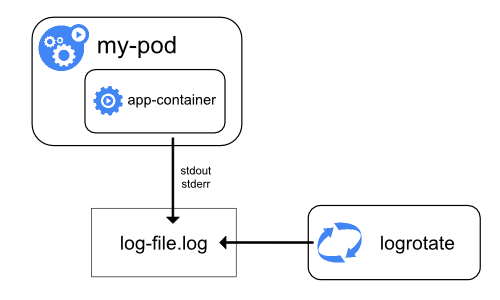
An important consideration in node-level logging is implementing log rotation,
so that logs don’t consume all available storage on the node. Kubernetes
currently is not responsible for rotating logs, but rather a deployment tool
should set up a solution to address that.
For example, in Kubernetes clusters, deployed by the kube-up.sh script,
there is a logrotate
tool configured to run each hour. You can also set up a container runtime to
rotate application’s logs automatically, e.g. by using Docker’s log-opt.
In the kube-up.sh script, the latter approach is used for COS image on GCP,
and the former approach is used in any other environment. In both cases, by
default rotation is configured to take place when log file exceeds 10MB.
As an example, you can find detailed information about how kube-up.sh sets
up logging for COS image on GCP in the corresponding script.
When you run kubectl logs as in
the basic logging example, the kubelet on the node handles the request and
reads directly from the log file, returning the contents in the response.
Note: Currently, if some external system has performed the rotation, only the contents of the latest log file will be available throughkubectl logs. E.g. if there’s a 10MB file,logrotateperforms the rotation and there are two files, one 10MB in size and one empty,kubectl logswill return an empty response.
System component logs
There are two types of system components: those that run in a container and those that do not run in a container. For example:
- The Kubernetes scheduler and kube-proxy run in a container.
- The kubelet and container runtime, for example Docker, do not run in containers.
On machines with systemd, the kubelet and container runtime write to journald. If
systemd is not present, they write to .log files in the /var/log directory.
System components inside containers always write to the /var/log directory,
bypassing the default logging mechanism. They use the klog
logging library. You can find the conventions for logging severity for those
components in the development docs on logging.
Similarly to the container logs, system component logs in the /var/log
directory should be rotated. In Kubernetes clusters brought up by
the kube-up.sh script, those logs are configured to be rotated by
the logrotate tool daily or once the size exceeds 100MB.
Cluster-level logging architectures
While Kubernetes does not provide a native solution for cluster-level logging, there are several common approaches you can consider. Here are some options:
- Use a node-level logging agent that runs on every node.
- Include a dedicated sidecar container for logging in an application pod.
- Push logs directly to a backend from within an application.
Using a node logging agent
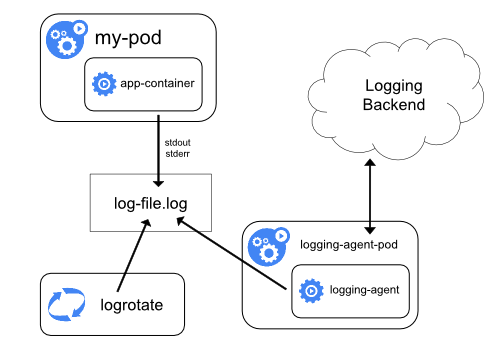
You can implement cluster-level logging by including a node-level logging agent on each node. The logging agent is a dedicated tool that exposes logs or pushes logs to a backend. Commonly, the logging agent is a container that has access to a directory with log files from all of the application containers on that node.
Because the logging agent must run on every node, it’s common to implement it as either a DaemonSet replica, a manifest pod, or a dedicated native process on the node. However the latter two approaches are deprecated and highly discouraged.
Using a node-level logging agent is the most common and encouraged approach for a Kubernetes cluster, because it creates only one agent per node, and it doesn’t require any changes to the applications running on the node. However, node-level logging only works for applications’ standard output and standard error.
Kubernetes doesn’t specify a logging agent, but two optional logging agents are packaged with the Kubernetes release: Stackdriver Logging for use with Google Cloud Platform, and Elasticsearch. You can find more information and instructions in the dedicated documents. Both use fluentd with custom configuration as an agent on the node.
Using a sidecar container with the logging agent
You can use a sidecar container in one of the following ways:
- The sidecar container streams application logs to its own
stdout. - The sidecar container runs a logging agent, which is configured to pick up logs from an application container.
Streaming sidecar container
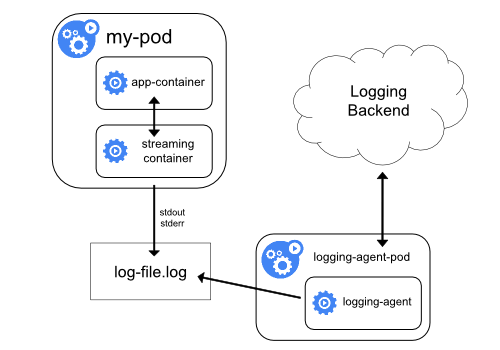
By having your sidecar containers stream to their own stdout and stderr
streams, you can take advantage of the kubelet and the logging agent that
already run on each node. The sidecar containers read logs from a file, a socket,
or the journald. Each individual sidecar container prints log to its own stdout
or stderr stream.
This approach allows you to separate several log streams from different
parts of your application, some of which can lack support
for writing to stdout or stderr. The logic behind redirecting logs
is minimal, so it’s hardly a significant overhead. Additionally, because
stdout and stderr are handled by the kubelet, you can use built-in tools
like kubectl logs.
Consider the following example. A pod runs a single container, and the container writes to two different log files, using two different formats. Here’s a configuration file for the Pod:
admin/logging/two-files-counter-pod.yaml
|
|---|
|
It would be a mess to have log entries of different formats in the same log
stream, even if you managed to redirect both components to the stdout stream of
the container. Instead, you could introduce two sidecar containers. Each sidecar
container could tail a particular log file from a shared volume and then redirect
the logs to its own stdout stream.
Here’s a configuration file for a pod that has two sidecar containers:
admin/logging/two-files-counter-pod-streaming-sidecar.yaml
|
|---|
|
Now when you run this pod, you can access each log stream separately by running the following commands:
kubectl logs counter count-log-10: Mon Jan 1 00:00:00 UTC 2001
1: Mon Jan 1 00:00:01 UTC 2001
2: Mon Jan 1 00:00:02 UTC 2001
...
kubectl logs counter count-log-2Mon Jan 1 00:00:00 UTC 2001 INFO 0
Mon Jan 1 00:00:01 UTC 2001 INFO 1
Mon Jan 1 00:00:02 UTC 2001 INFO 2
...
The node-level agent installed in your cluster picks up those log streams automatically without any further configuration. If you like, you can configure the agent to parse log lines depending on the source container.
Note, that despite low CPU and memory usage (order of couple of millicores
for cpu and order of several megabytes for memory), writing logs to a file and
then streaming them to stdout can double disk usage. If you have
an application that writes to a single file, it’s generally better to set
/dev/stdout as destination rather than implementing the streaming sidecar
container approach.
Sidecar containers can also be used to rotate log files that cannot be
rotated by the application itself. An example
of this approach is a small container running logrotate periodically.
However, it’s recommended to use stdout and stderr directly and leave rotation
and retention policies to the kubelet.
Sidecar container with a logging agent
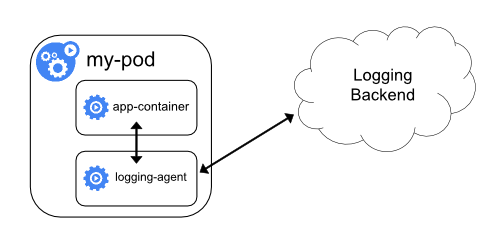
If the node-level logging agent is not flexible enough for your situation, you can create a sidecar container with a separate logging agent that you have configured specifically to run with your application.
Note: Using a logging agent in a sidecar container can lead to significant resource consumption. Moreover, you won’t be able to access those logs usingkubectl logscommand, because they are not controlled by the kubelet.
As an example, you could use Stackdriver, which uses fluentd as a logging agent. Here are two configuration files that you can use to implement this approach. The first file contains a ConfigMap to configure fluentd.
admin/logging/fluentd-sidecar-config.yaml
|
|---|
|
Note: The configuration of fluentd is beyond the scope of this article. For information about configuring fluentd, see the official fluentd documentation.
The second file describes a pod that has a sidecar container running fluentd. The pod mounts a volume where fluentd can pick up its configuration data.
admin/logging/two-files-counter-pod-agent-sidecar.yaml
|
|---|
|
After some time you can find log messages in the Stackdriver interface.
Remember, that this is just an example and you can actually replace fluentd with any logging agent, reading from any source inside an application container.
Exposing logs directly from the application
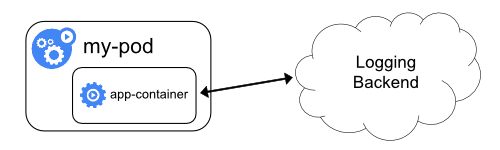
You can implement cluster-level logging by exposing or pushing logs directly from every application; however, the implementation for such a logging mechanism is outside the scope of Kubernetes.
Feedback
Was this page helpful?
Thanks for the feedback. If you have a specific, answerable question about how to use Kubernetes, ask it on Stack Overflow. Open an issue in the GitHub repo if you want to report a problem or suggest an improvement.